The US 30-Year Treasury bond rose nearly seven points on Friday, the most since 2009, as investors continued to flee risk assets and buy government debt. Ten-year US inflation-indexed government bonds now yield negative 0.57%, less than Japanese government debt, vs positive 0.80% a year ago. Never in US history have yields been this low, so there is no historical benchmark against which to gauge what this means.
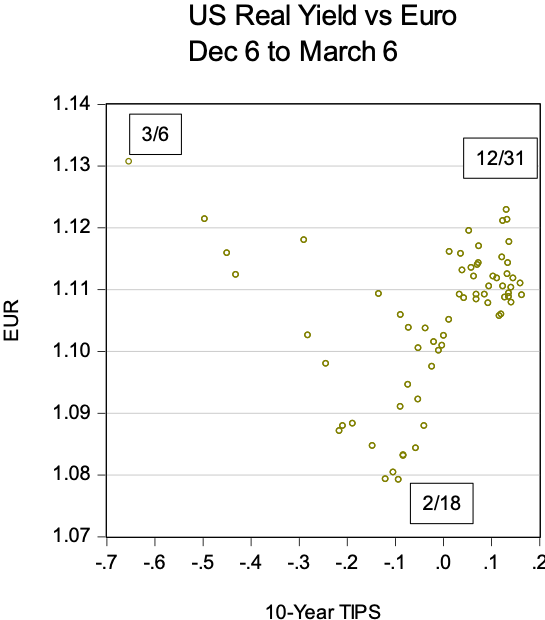
The market, though, gives us clues about the meaning of imploding bond yields. As the V-shaped chart below makes clear, the US dollar strengthened vs the euro while the inflation-index (or “real”) Treasury yield fell between December 31 of last year and February 18, the turning point in the Chinese phase of the coronavirus epidemic. Between February 18 and March 6, though, the dollar weakened as bond yields continued to fall. The 90-degree shift in the relationship between bond yields and the euro tells us that something important changed. The dollar acted as a safe haven, rising along with inflation-indexed Treasuries (whose price trades inversely to yield).
In mid-February, the dollar suddenly ceased to be a safe haven.
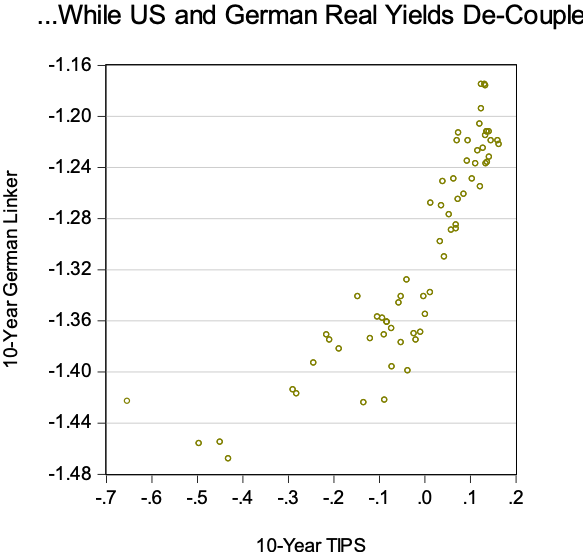
During the first six weeks of the year, moreover, “real” US yields traded closely with German real yields. After the third week of February the link disappeared. German real yields actually moved up slightly as Treasury yields crashed.
What happened in mid-February is that expectations about the Chinese economy turned up as investors concluded that the Chinese authorities had the public health situation in hand, while expectations about the US economy turned down.
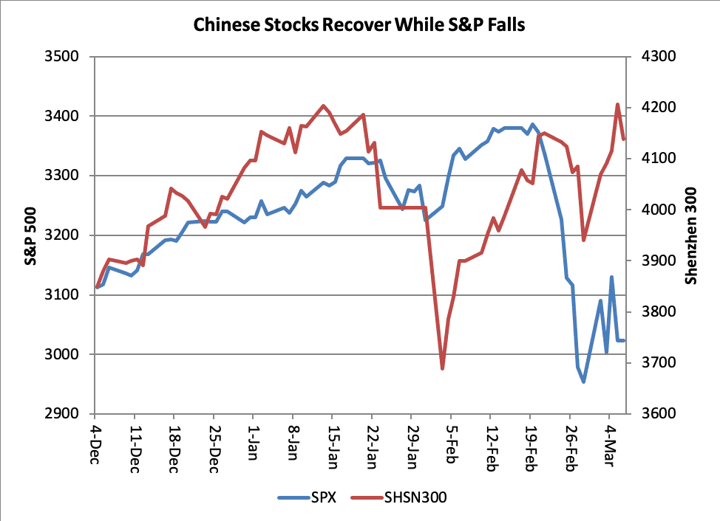
After a crash in late January, the Shenzhen 300 index regained its previous high, while the S&P 500 fell sharply. That’s when the dollar turned around.
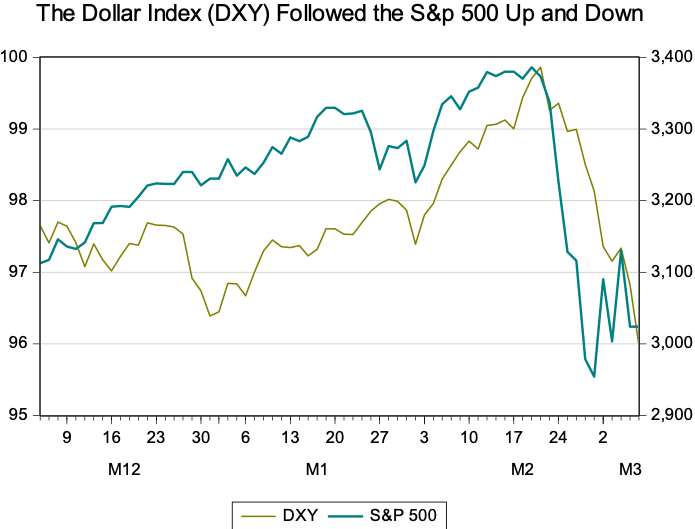
The US stock market has led the trade-weighted dollar index (DXY) up as well as down during the past year.
The dollar isn’t a safe haven because there aren’t enough safe assets to make it a haven. Utilities stocks are an example: Under normal conditions, they trade like bonds, because this regulated industry has highly predictable cash flows. During the last couple of weeks, though, utilities stocks have fallen (using the XLU ETF as a benchmark) despite the fall in bond yields. The sector is worth about 10% less than the historical relationship with the 30-year bond yield indicates.
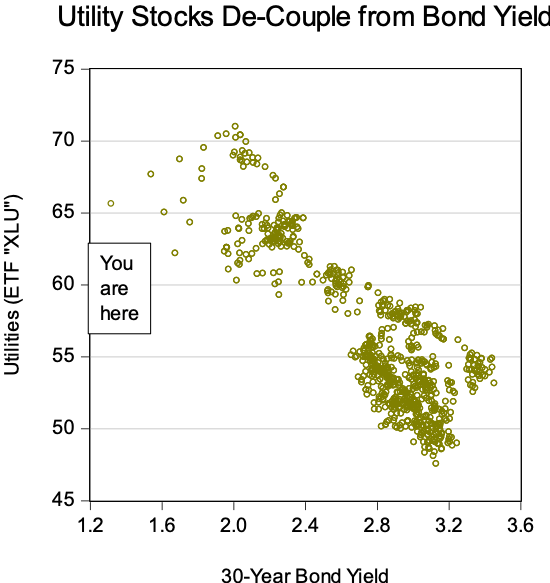
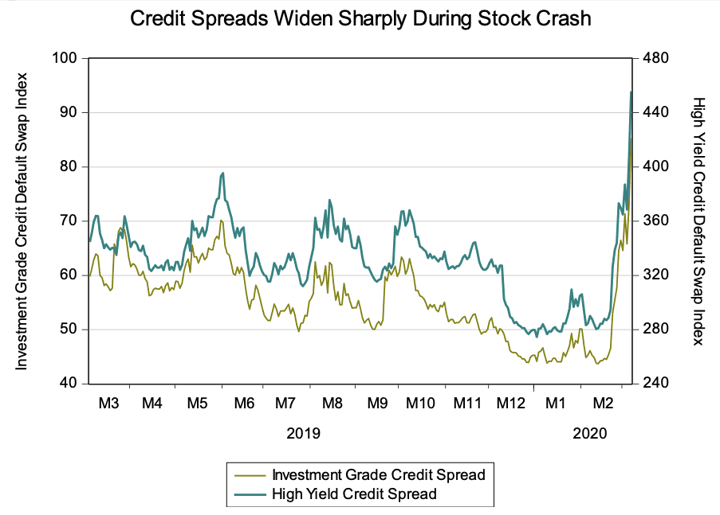
The reason for the de-coupling is simple. To turn meager profits into higher yields for investors, utilities have increased their leverage during the past decade. Before the 2008 crash, utilities had net debt equal to three times their earnings before depreciation, interest and taxes. Now the ratio is well over five times. The stock market correction sparked a sharp deterioration in credit markets, putting a cloud over the most-levered stock market sectors, including utilities as well as real estate.
During the March 6 session, utilities performed worse than the broad market, despite the near-record crash in the long-term bond yield. That underperformance implies that jump in credit risk has undermined confidence in the reliability of the cash flows of what used to be considered bond-like assets.


